Nanolive’s patented technology
A microscopes’ resolution depends on its capacity to collect diffracted light, the bigger this aperture, the clearer the view. With our rotating light source we illuminate the sample from many directions and with a technique called interferometry, we can combine the signals “seen” by hundreds of illumination angles, so that the microscope effectively works together like one giant aperture. As a result, this allows us to compute (no ocular, no eyepieces) a signal with sub-cellular resolution of living cells and thanks to interferometry we do not require any chemical markers and we can compute a “digital cell reconstruction in 3D” – based upon the cell’s inherent physical properties.
How does the 3D Cell Explorer produce cell images with better than 200 nm lateral resolution?
Non-invasive optical nanoscopy can achieve such a lateral resolution by using a quasi-2π-holographic detection scheme and complex deconvolution. The spatial frequencies of the imaged cell do not make any sense to the human eye. But these SCATTERED frequencies are converted into a hologram and synthesize a bandpass which has a resolution DOUBLE the one normally available.
What does fixation do to your cells’ morphology?
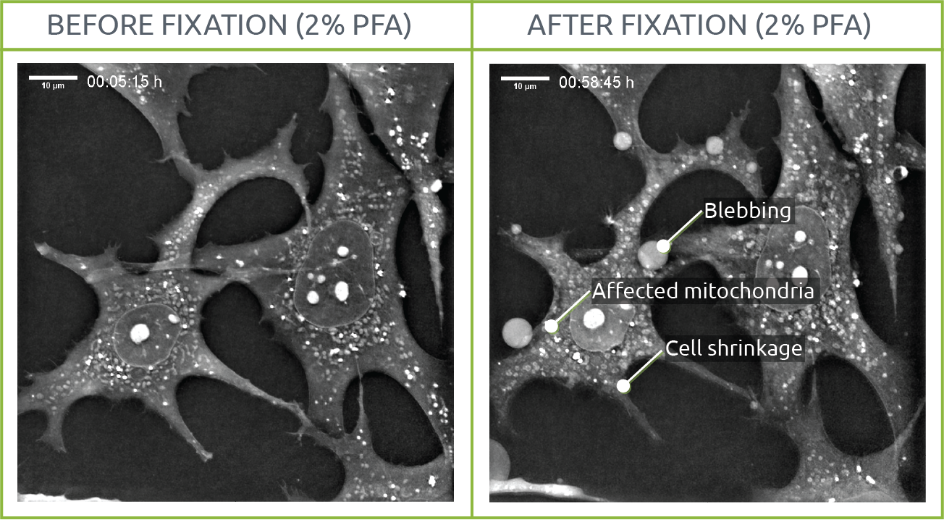
Since fixation aims to provide a snapshot of a living situation, we visualized the process of fixing living samples with PFA using Nanolive’s 3D Cell Explorer. We conclude that cell structures are affected by the fixation process.
What does fixation do to your cells’ morphology?
Since fixation aims to provide a snapshot of a living situation, we visualized the process of fixing living samples with PFA using Nanolive’s 3D Cell Explorer. We conclude that cell structures are affected by the fixation process.
Overcoming phototoxicity
Very few studies have been highlighting or discussing the artifacts arising from phototoxicity during live cell imaging. With Nanolive imaging, a low-power laser beam gets phase-shifted when sent through samples, this phase shift is then used to generate 3D-images of refractive indices of the observed samples. This way this technology gets rid of invasive fluorescent markers, while using low energy exposure regimes is a clear added value that makes it well suited to observe living samples, when compared to epifluorescence imaging. Moreno’s et al results raised the question of how much of our knowledge, particularly about mitochondria, may have been biased by artifacts induced by fluorescence imaging.
Technical Comparison
Please scroll the table right to see the full comparison
| Properties |  |
Standard Fluorescence | Super resolution Fluorescence | Phase imaging | Electrical impedance | SEM, AFM |
| Preparation | ||||||
| Time | ||||||
| Simplicity |  |
 |
 |
 |
 |
 |
| Cost | ||||||
| Cell condition | ||||||
| Observation | ||||||
| Temporal sampling | ||||||
| Live Cell Imaging | ||||||
| Training-free | ||||||
| Cellular health | ||||||
| Result | ||||||
| Lateral Resolution | Below 200nm | Down to 250nm | Down to 50nm | 400 – 1000nm | No Image | 5-10nm |
| Image Dimensionality | ||||||
| Quantitative | ||||||
| Comprehensive | ||||||
| Costs | ||||||
| Price (euro) |  |
Nanolive imaging and analysis platforms
Swiss high-precision imaging and analysis platforms that look instantly inside label-free living cells in 3D
CX-A
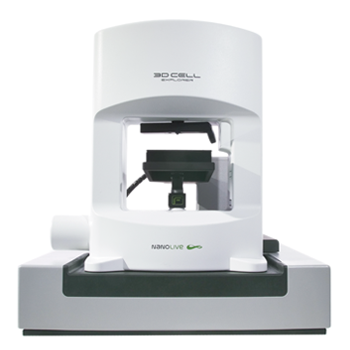
Automated live cell imaging and analysis: a unique walk-away solution for long-term live cell imaging of single cells and cell populations
3D CELL EXPLORER-fluo
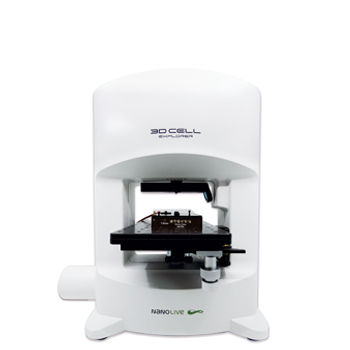
Multimodal Complete Solution: combine high quality non-invasive 4D live cell imaging with fluorescence
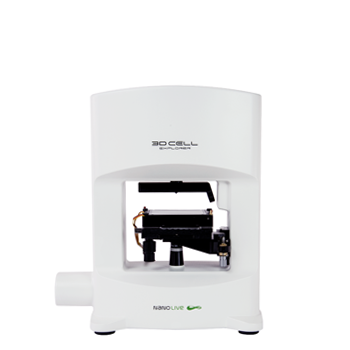
3D CELL EXPLORER
Budget-friendly, easy-to-use, compact solution for high quality non-invasive 4D live cell imaging

