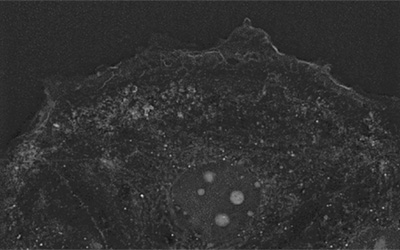
In this footage, obtained using Nanolive’s 3D Cell Explorer-fluo we observe the progression of GFP-labelled adenovirus in human bone osteosarcoma epithelial (U2OS) cells.
Adenovirus is known to migrate to the nucleus of its host cell where it forms structures known as adenovirus replication compartments (AdRCs) – specialized nuclear microdomains that synthesize viral DNA and RNA. At the end of the infectious cycle, adenoviruses induce lysis of the host cell and go on to attack and propagate neighbouring cells.
In this experiment, DNA binding protein was labelled with GFP, and so, the green signal we observe in the video reports the position of AdRCs, allowing us to visualize the progression of the infection. U2OS cells were infected at a MIO of 30 and imaging was started 6 h post-infection. The life cycle of adenovirus is ~48 h, so these images represent the early stages of the infection process. Refractive images were taken every 15 s for 1 hour 25 mins, and fluorescence images were taken every 5 mins using the FITC channel.
We spoke to Prof. Clodagh O’Shea from the Salk Institute for Biological Studies (La Jolla, CA, USA) to discuss some of the unique observations in this video.
“Nanolive cell imaging is the only way of studying the phase-transition that occurs in response to the increase in AdRCs, in real time. We see deformations in the nuclear membrane as the virus propagates, which cannot be visualized with other technologies”.
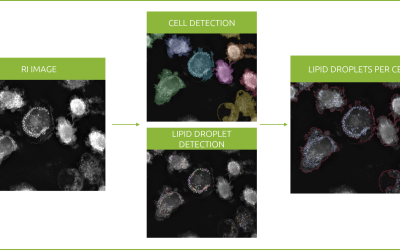
Changes in cell membranes are intimately connected with modifications in lipid metabolism and so, Prof. O’Shea’s lab are interested in combining microscopy with lipidomic studies.
“Normally changes in lipid metabolism are very hard to trace because we don’t know what is upstream and what is downstream. With Nanolive cell imaging we can visualize the responses of lipid droplets, mitochondria and cell membranes all at the same time, and so, if we combine this with mutant forms of adenoviruses it could be a great way of identifying key lipid pathways affected during infection”.
Another question O’Shea’s lab is keen in studying are the density changes that occur during phase-transition. For this, Nanolive’s 3D rendering tool could be invaluable, as it allows to map changes in the nucleus and quickly identify positions of interest with ease.
Nanolive would like to thank Prof. O’Shea, Dr. Akiko Inagaki and Dr. Horng Ou for preparing the samples and for taking the time to talk to us. Best of luck for the future!
Read our latest news
Revolutionizing lipid droplet analysis: insights from Nanolive’s Smart Lipid Droplet Assay Application Note
Introducing the Smart Lipid Droplet Assay: A breakthrough in label-free lipid droplet analysis Discover the power of Nanolive's Smart Lipid Droplet Assay (SLDA), the first smart digital assay to provide a push-button solution for analyzing lipid droplet dynamics,...
Food additives and gut health: new research from the University of Sydney
The team of Professor Wojciech Chrzanowski in the Sydney Pharmacy School at the University of Sydney have published their findings on the toxic effect of titanium nanoparticles found in food. The paper “Impact of nano-titanium dioxide extracted from food products on...
2023 scientific publications roundup
2023 has been a record year for clients using the Nanolive system in their scientific publications. The number of peer-reviewed publications has continued to increase, and there has been a real growth in groups publishing pre-prints to give a preview of their work....
Nanolive microscopes
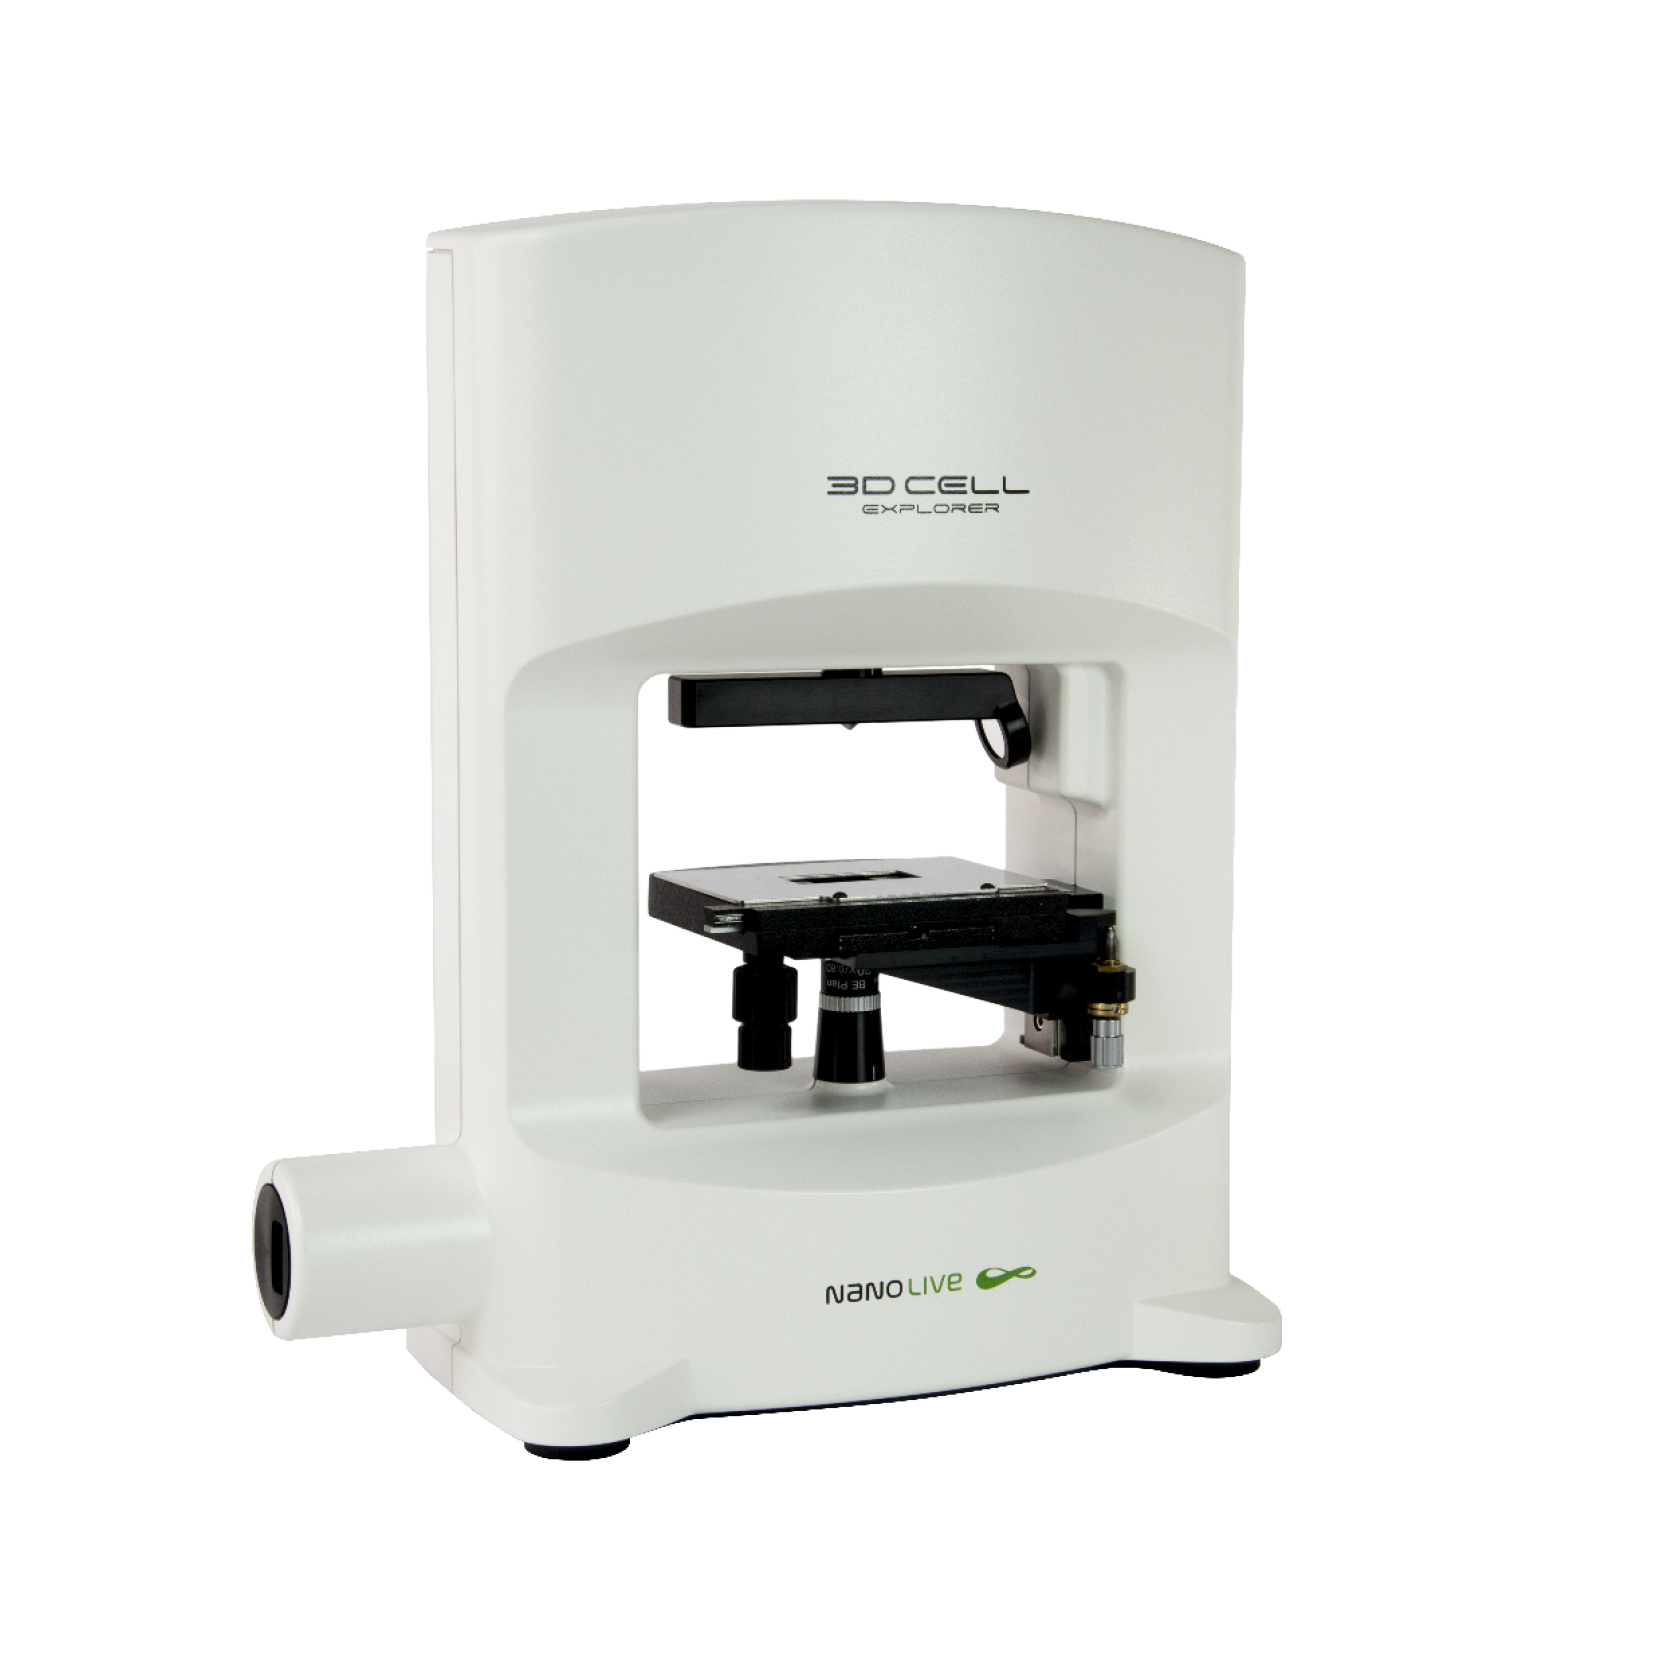
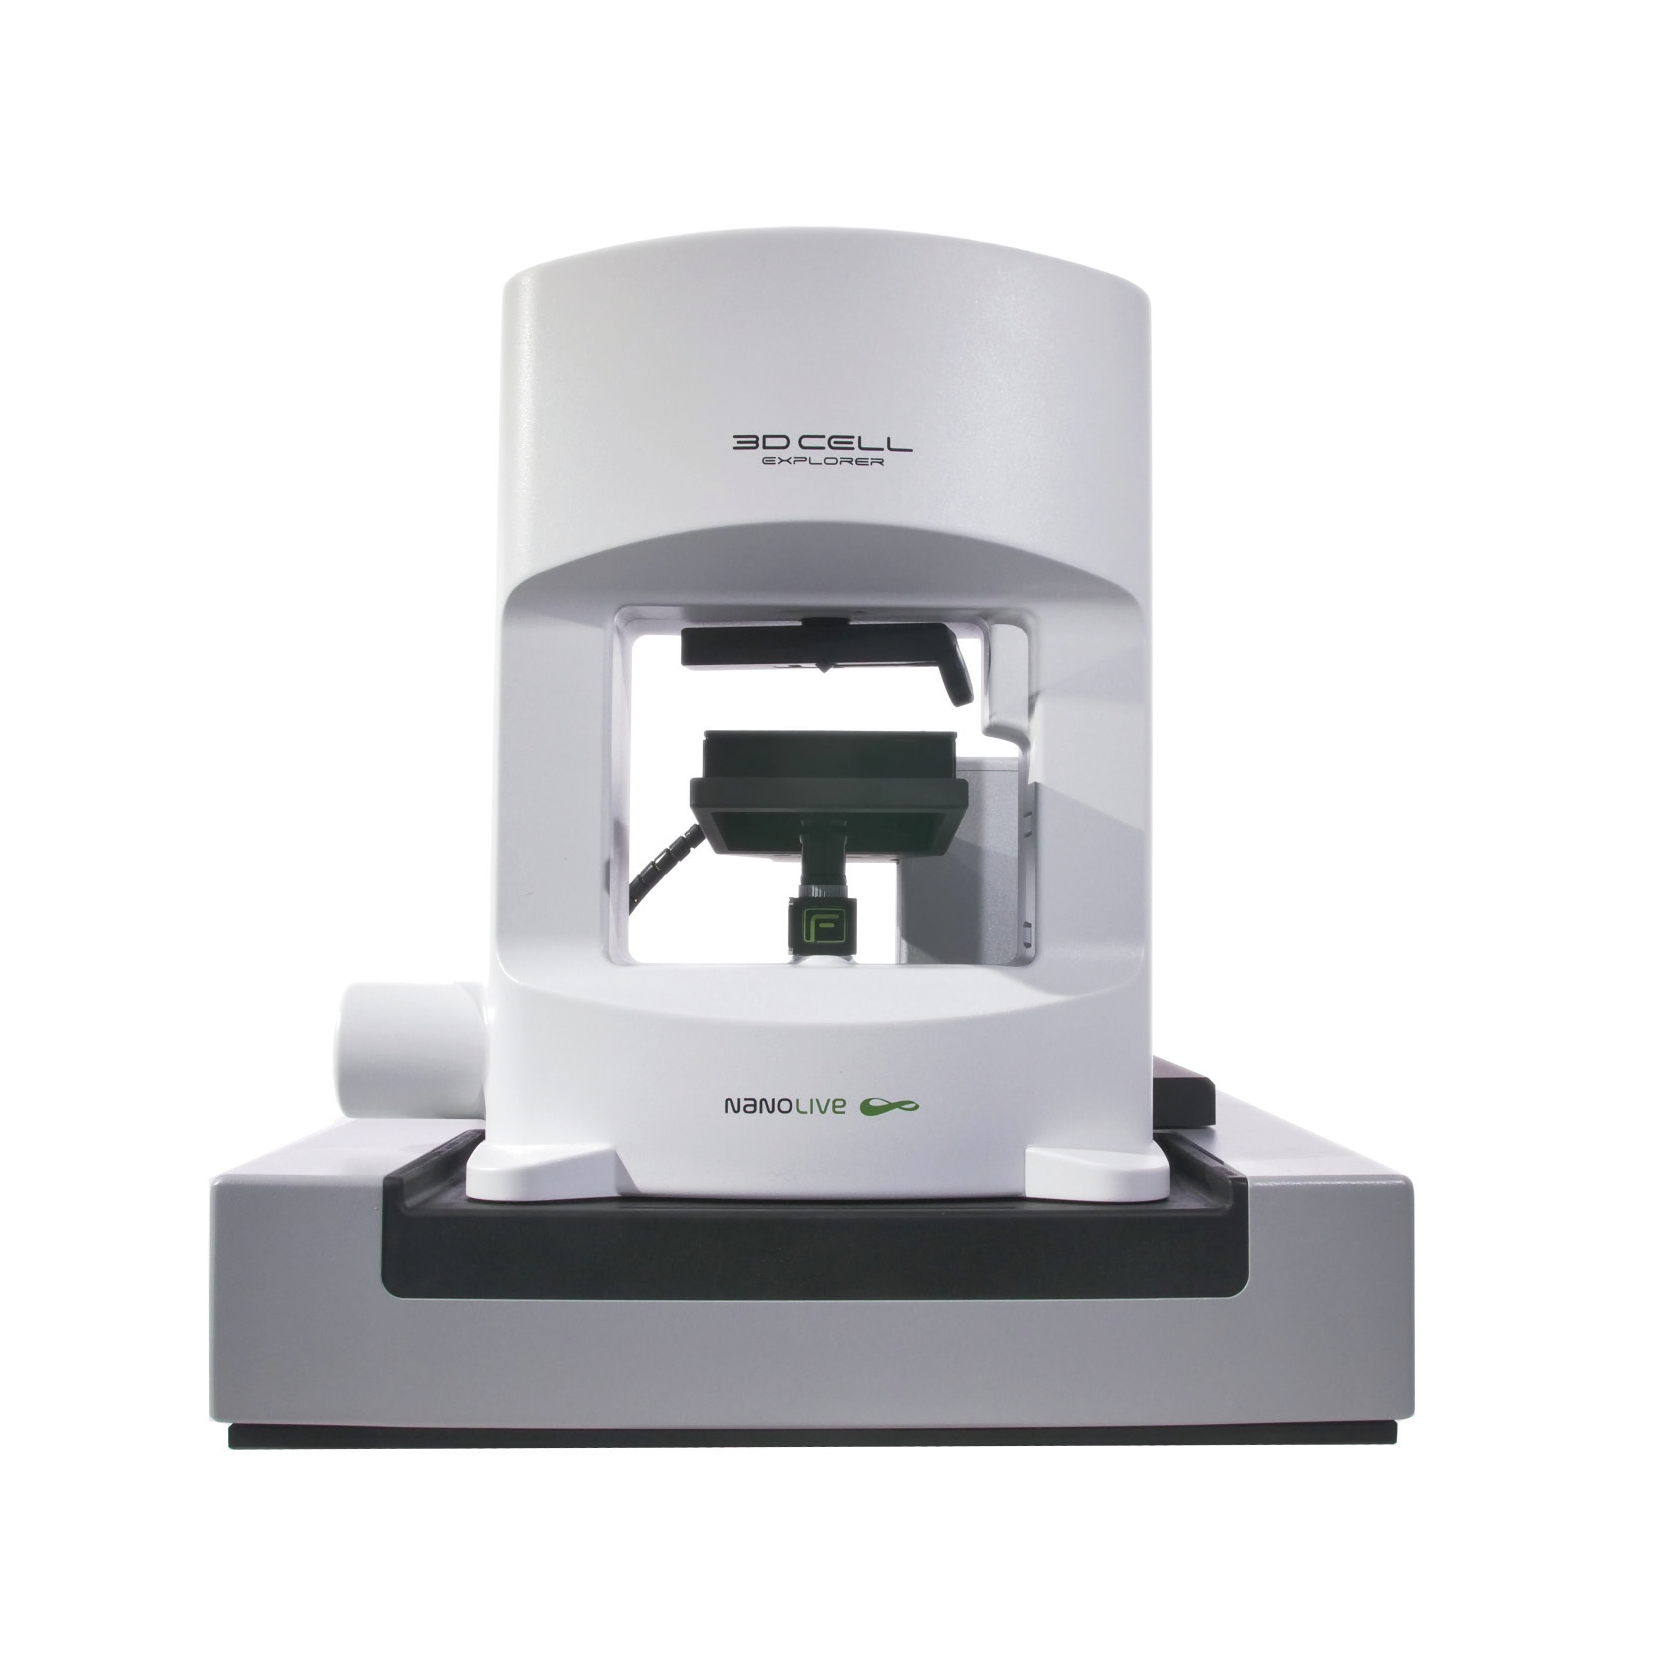
3D CELL EXPLORER
Budget-friendly, easy-to-use, compact solution for high quality non-invasive 4D live cell imaging
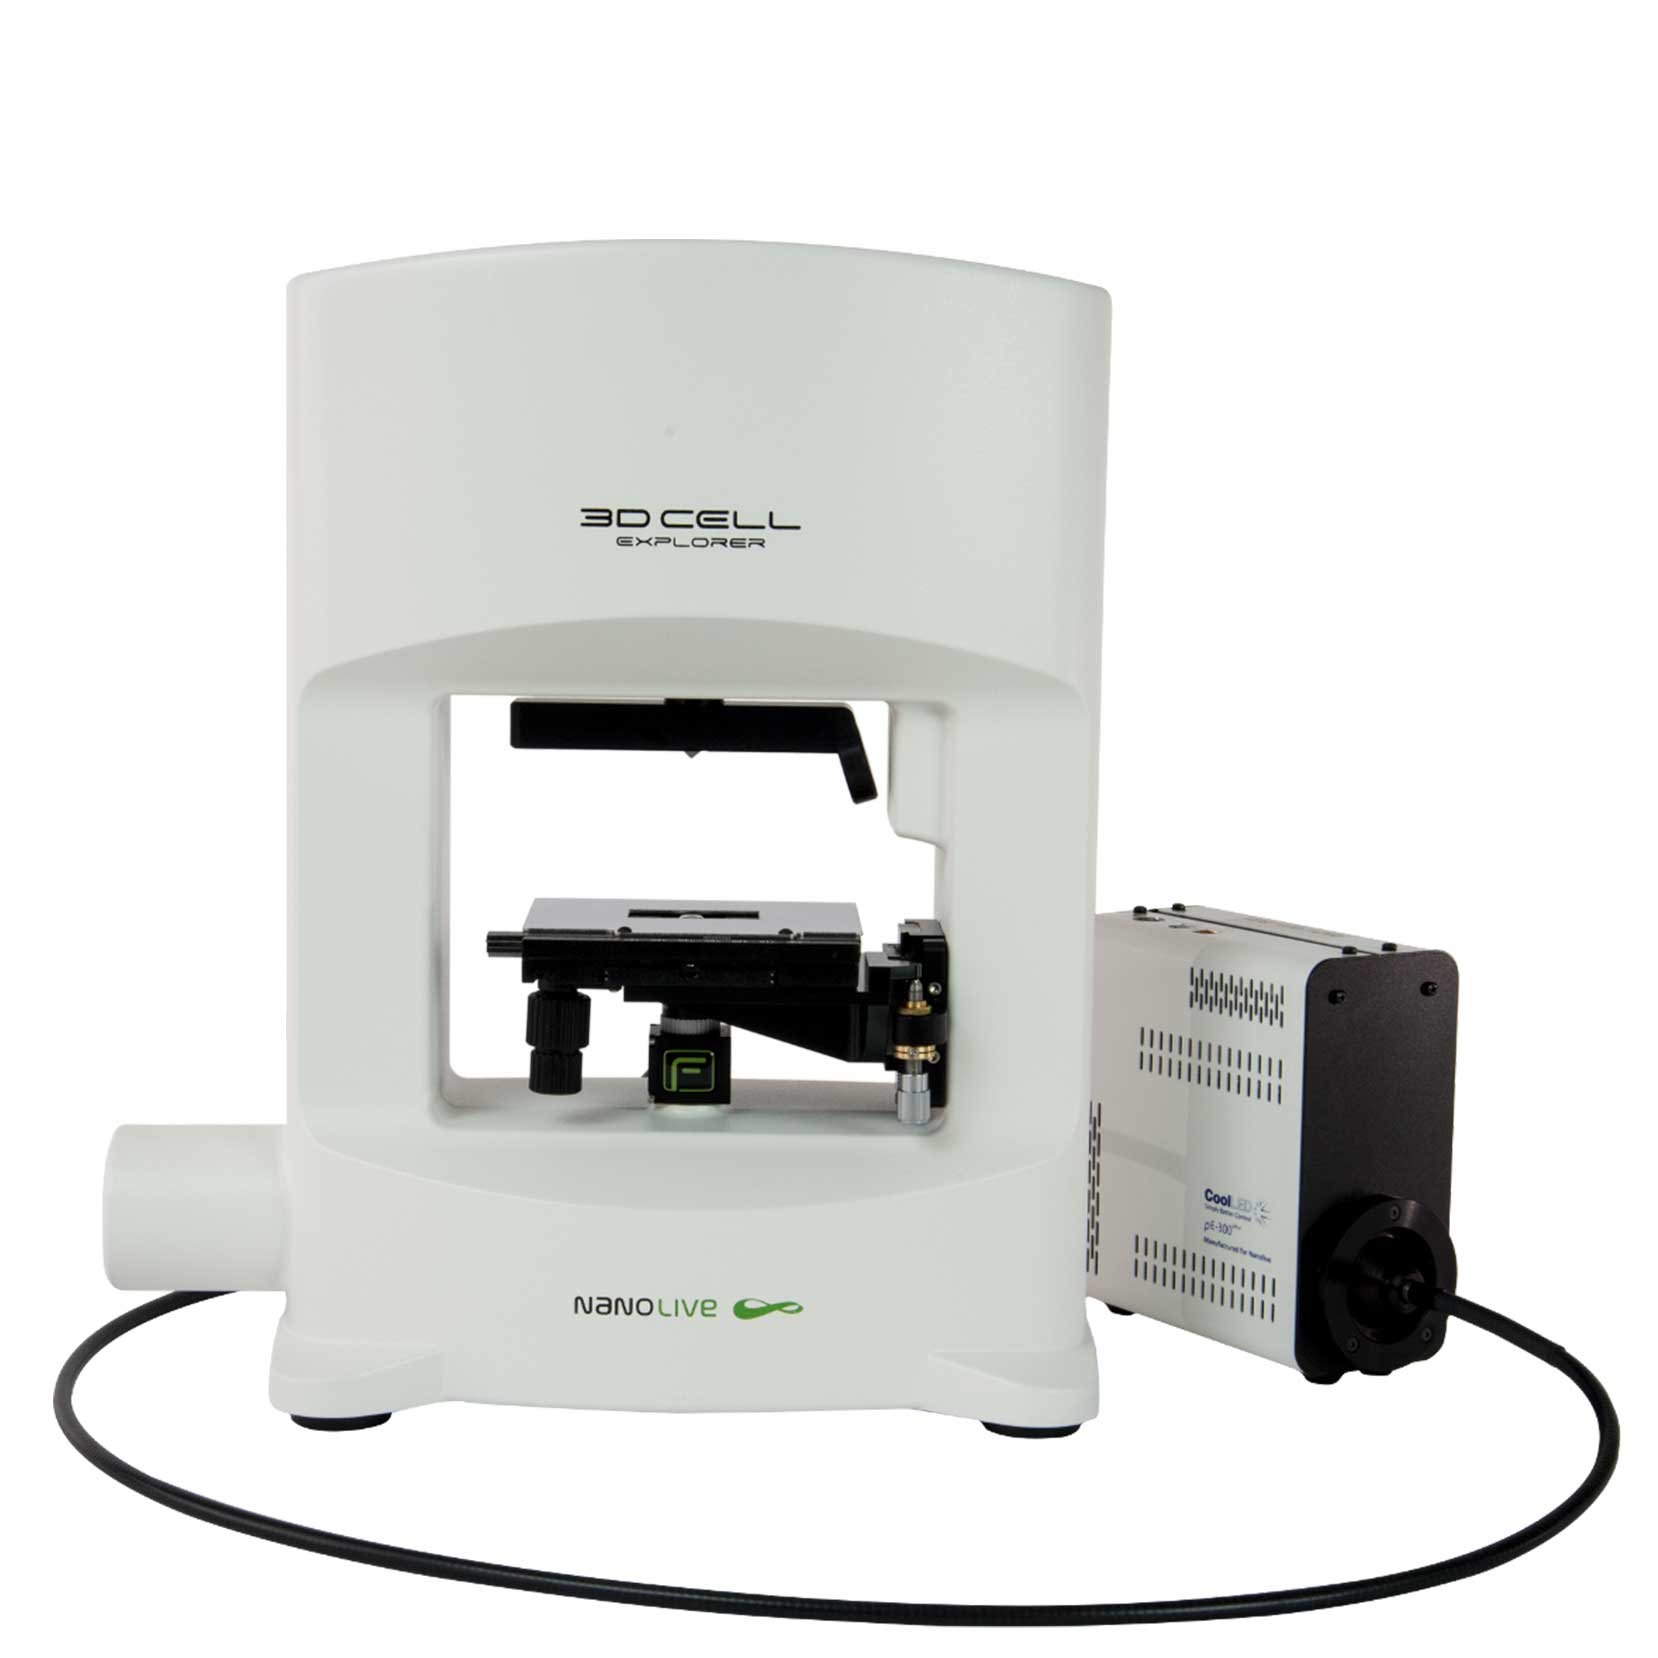
3D CELL EXPLORER-fluo
Multimodal Complete Solution: combine high quality non-invasive 4D live cell imaging with fluorescence
CX-A
Automated live cell imaging: a unique walk-away solution for long-term live cell imaging of single cells and cell populations