The 3D Cell Explorer: A "Super Resolution" Optical microscope
Why the 3D Cell Explorer “seems” to break the laws of resolution
Nanolive developed a revolutionary light microscope for live cell exploration. This high-tech system is based on a technology called holo-tomography combined with an algorithm that allows the scanning of the inside of a living cell in 3D, without killing this cell.
This Nanolive’s technology combines the best performances in terms of spatial and temporal resolution for an optical microscope, with a total lack of photo-toxicity.

On the top-left image you can find a 2D slice from the RI map of a mouse fibroblast. The small images show its internal compartments (a. nucleus + nuclear membrane, b. lipid droplets, c. lysosomes, d. plasma membrane, e. nucleoli, f. mitochondria). The top right animation shows the 3D reconstruction of the mouse fibroblast.
Characteristics of an optical microscope
A common and valid challenge raised to the imaging capabilities of the Nanolive’s 3D Cell Explorer (lateral resolution below 200 nm) is that it is impossible to reach such a resolution when applying classical imaging concepts and constraints. This is because the 3D Cell Explorer’s is not a standard optical microscope and its performance is not limited by classical light microscopy constraints.
The theory of Optical microscopy
Classical Optical Microscopy (e.g. epifluorescence)
In a standard light microscope the cell is directly imaged; so what you see on your camera is the image of the cell. Therefore, one absolutely needs to apply Nyquist sampling on the camera. But, this is NOT true for the 3D Cell Explorer. The paradigm shift to make is that it is not a classical optical microscope and there is no direct imaging of the cell on the camera.
So how does the 3D Cell Explorer produce cell images with better lateral resolution than a standard light microscope?
Non-invasive optical nanoscopy can achieve such a lateral resolution by using a quasi-2π-holographic detection scheme and complex deconvolution. The spatial frequencies of the imaged cell do not make any sense to the human eye. But these SCATTERED frequencies are converted into a hologram and synthesize a bandpass which has a resolution DOUBLE the one normally available for a classical optical microscope. Holograms are recorded from different illumination directions on the sample plane and observe sub-wavelength tomographic variations of the specimen. Nanoscale apertures serve to calibrate the tomographic reconstruction and to characterize the imaging system by means of the coherent transfer function. This gives rise to realistic inverse filtering and guarantees true complex field reconstruction.
All of the math and proofs are explained in great detail in our peer reviewed Nature Photonics publication here: https://www.nature.com/articles/nphoton.2012.329.
Explaining the Resolution Jump
In classical optical microscopes the Rayleigh resolution for incoherent light (e.g. fluo) is 400nm=0.61*520nm/(0.8), for coherent light (e.g. holography) 533nm=0.82*520nm/(0.8) with the diffraction limit (e.g. any imaging by niquist) of 325nm=0.5*520nm/(0.8). In our case for the 3D Cell Explorer configuration, the maximal expected resolution is around 160nm=0.5*520nm/(2*0.8) and we estimate the real resolution (according to Rayleigh) to be about ~190nm. Therefore, taking into account the illuminating wavelength, the experimental resolution of this special light microscope is 190nm=/lambda/(3.5 NA), indicating a sub-diffraction resolution (d=325 nm at given wavelength and NA) imaging in far-field (non-fluorescent) transmission microscopy.
In conclusion, the 2 terminologies of (i) optical resolution (the real one) and (ii) sampling resolution (the one on the screen) are separated for 3D holotomographic microscopy. For the sake of computational cost-reduction, Nanolive chose to have the sampling optimal at the optical resolution, hence about 180 nm. Again, we can do this, thanks to our technology WITHOUT loosing any real resolution, but of course a user could over-sample the images and have double/triple/etc sampling on the screen with the same optical resolution (e.g. simple zero-padding in fft space to have a smoother image).
The Images
We have chosen Mitochondria as a great candidate to demonstrate resolution. Below is an image calculating the separation between Mitochondria using standard signal profiling. In the example we resolve mitochondria tubules as thin as 186 nm (using full width at half maximum standard measurement of object thickness).

Here is some nice Mitochondria video showing high resolution of living cells. On the left panel you can observe a time-lapse of pre-adipocytes imaged with the 3D Cell Explorer for 1 hour at a frequency of one image per five seconds (movie speed: 15fps). On the right panel we zoomed a portion of the field of view to better appreciate the interactions between mitochondria and lipid droplets. On the two small squares on the bottom, the two organelles are displayed for identification at different time points.
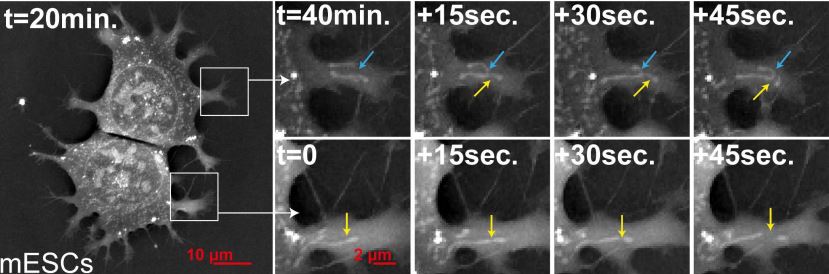
Finally here is an image showing Mitochondrial fission and fusion in mouse Embryonic Stem Cells.
Want to learn more ?
Explore our applications.